Before-and-after testosterone graphs: what a supplement advertisement leaves unanswered
A practical guide to interpreting hormone graphs, comparison groups, repeat measurements, and symptom outcomes in supplement advertising.
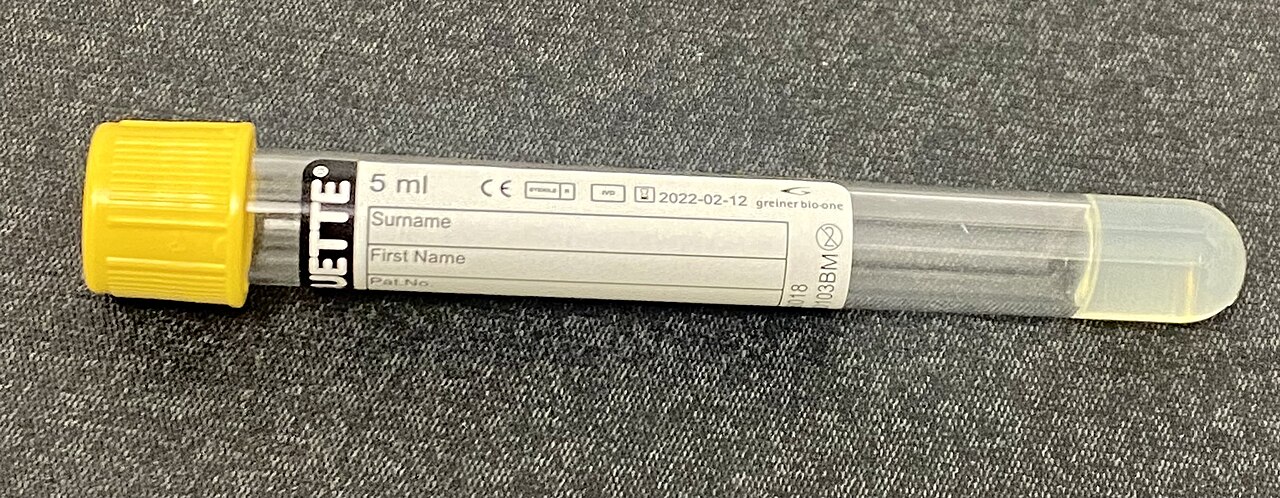
Two laboratory values do not establish a supplement effect or a diagnosis. Measurement conditions, clinical context, and controlled comparisons matter.
A graph can be accurate and still incomplete
A supplement advertisement may show a testosterone result before use and a higher result afterward. The numbers could be real, yet the presentation still cannot establish why they changed. Without a suitable comparison, consistent measurement conditions, and information about the person, the graph leaves major questions unanswered. A visual increase is an observation rather than a complete causal explanation.
Begin by asking what the graph represents. Is it one person's experience, an average from a trial, or a selected subgroup? Are the units shown? Does the vertical axis begin at zero, and does the scale exaggerate a small difference? These are ordinary reading questions. They do not presume dishonesty; they help identify how much information is actually available.
If two reports use different units or reference intervals, ask the laboratory or clinician to explain the comparison. Copying numbers without their units can create a false impression of a dramatic change.
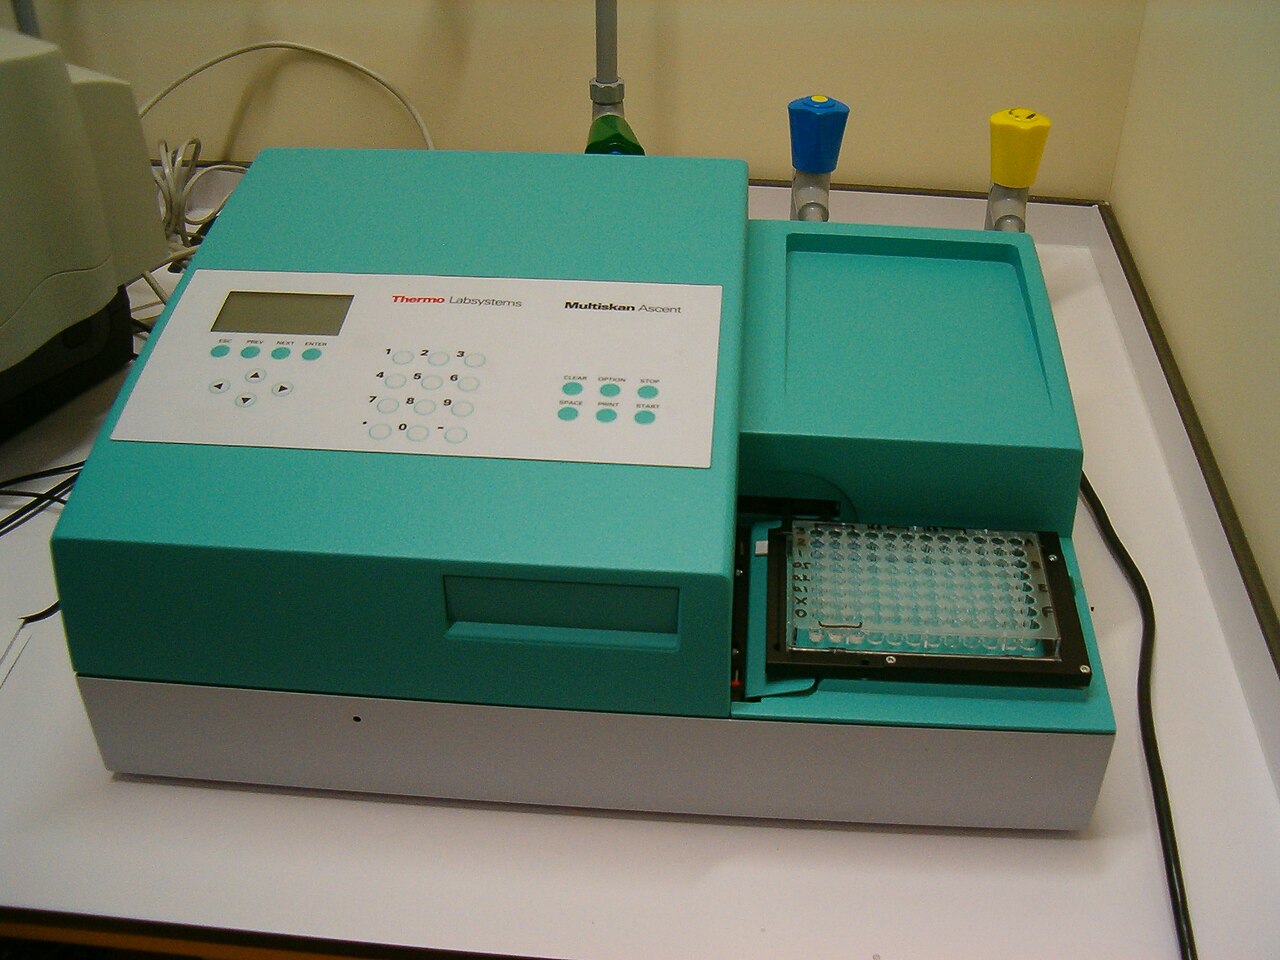
Measurement conditions belong beside the result
The Endocrine Society's hypogonadism guideline emphasizes symptoms together with consistently and unequivocally low testosterone, and recommends confirming a diagnosis with repeat morning fasting measurements. A professional position statement on biochemical confirmation likewise discusses biological and analytical variation. These recommendations illustrate why an isolated number cannot be interpreted as a self-contained diagnosis.
For a before-and-after graph, look for collection time, testing method, laboratory, and whether conditions were comparable. If those details are absent, the apparent change may be difficult to interpret. Do not assume a seller has controlled them simply because the graph looks clinical. The appropriate response is to ask for the underlying methods rather than supply missing information yourself.
The control group is the missing counterfactual
A randomized trial asks what happened with the intervention compared with what happened without it under the study's design. That comparison matters because values can change over time in either group. A product may be associated with an increase from baseline while failing to show a clear advantage over placebo. A graph that displays only the active group's rise cannot answer the controlled question.
Look for both groups, the number of participants, variation around the average, and the prespecified analysis. If the advertisement gives only a percentage, find out whether it is a relative change, an absolute difference, or a selected result. A large-looking percentage can start from a small baseline. The label on the axis and the comparison behind the figure matter more than the visual drama.

A laboratory rise does not establish every benefit
Even a genuine supplement-associated hormone change would not automatically demonstrate improved strength, desire, mood, or fertility. Those outcomes need to be assessed directly. A study that did not measure the benefit you care about cannot establish it through a hormone graph alone. The commercial argument may be adding a clinical conclusion that the research never tested.
Ask whether participants reported meaningful changes and whether any symptoms or adverse effects were monitored. If a trial measured several outcomes, check whether the highlighted one was the primary question or a favorable secondary finding. A balanced summary makes both favorable and unfavorable results visible. The goal is not to find a graph that confirms a purchase, but to determine what the whole study supports.
Use a result to start a clinical discussion
If you already have laboratory results and are worried, bring the original report, symptoms, medicines, and supplement list to a qualified clinician. Do not adjust products simply to make the next number higher. A clinical evaluation considers why testing was done and what the result means for the individual, rather than treating testosterone as a score to maximize.
This guide provides general information, not diagnostic thresholds or a treatment plan. It explains why a before-and-after graphic cannot settle a hormone question on its own. A useful claim should survive questions about measurement, comparison, and meaningful outcomes. If those details are unavailable, the graph remains an incomplete piece of evidence, however polished its presentation.
Sources & further reading
This article provides educational information. Ask a qualified clinician or pharmacist about your symptoms, medical conditions, medicines and supplement interactions.